
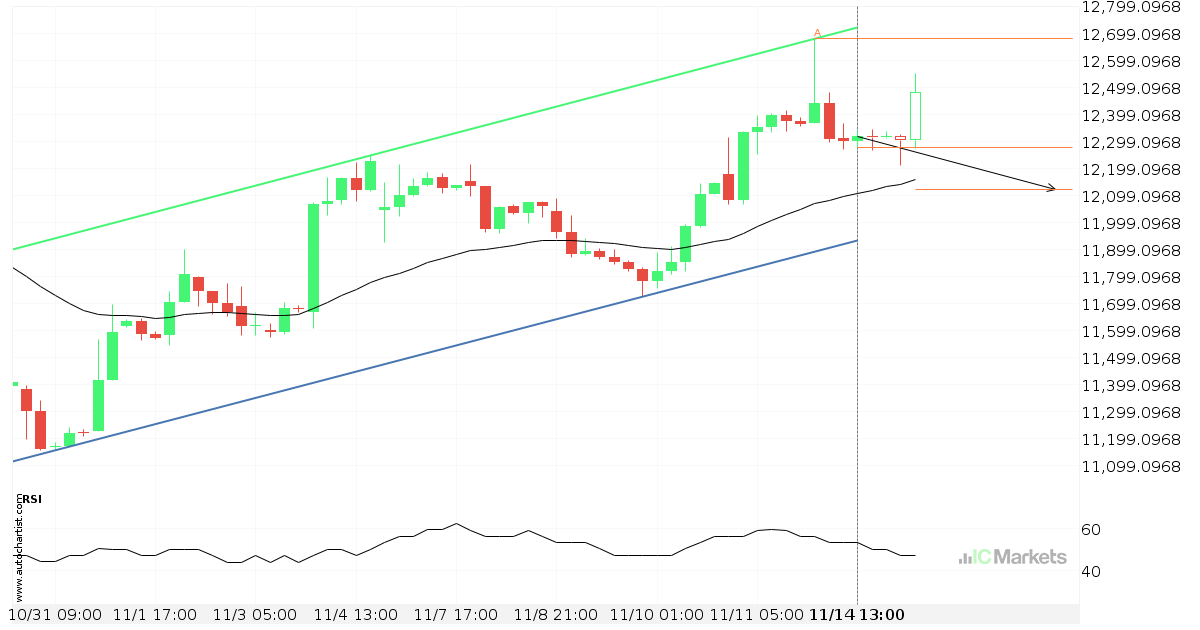
FTSE China A50 Index – getting close to support of a Channel Up
FTSE China A50 Index is moving towards a support line. Because we have seen it retrace from this line before, we could see either a break through this line, or a rebound back to current levels. It has touched this line numerous times in the last 28 days and may test it again within the […]
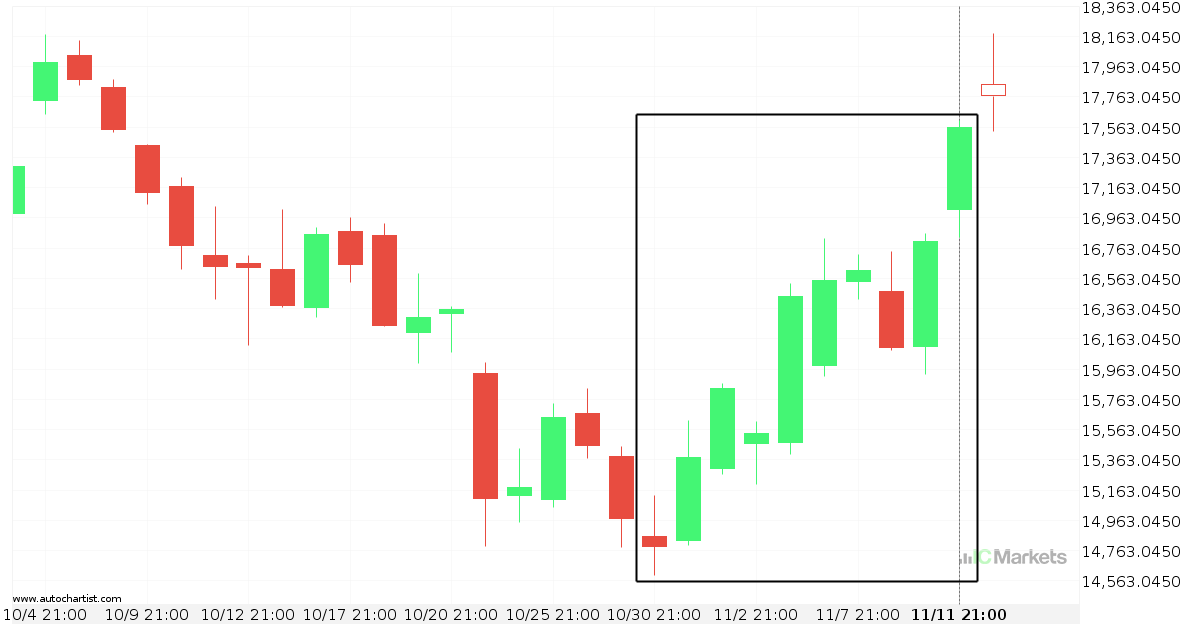
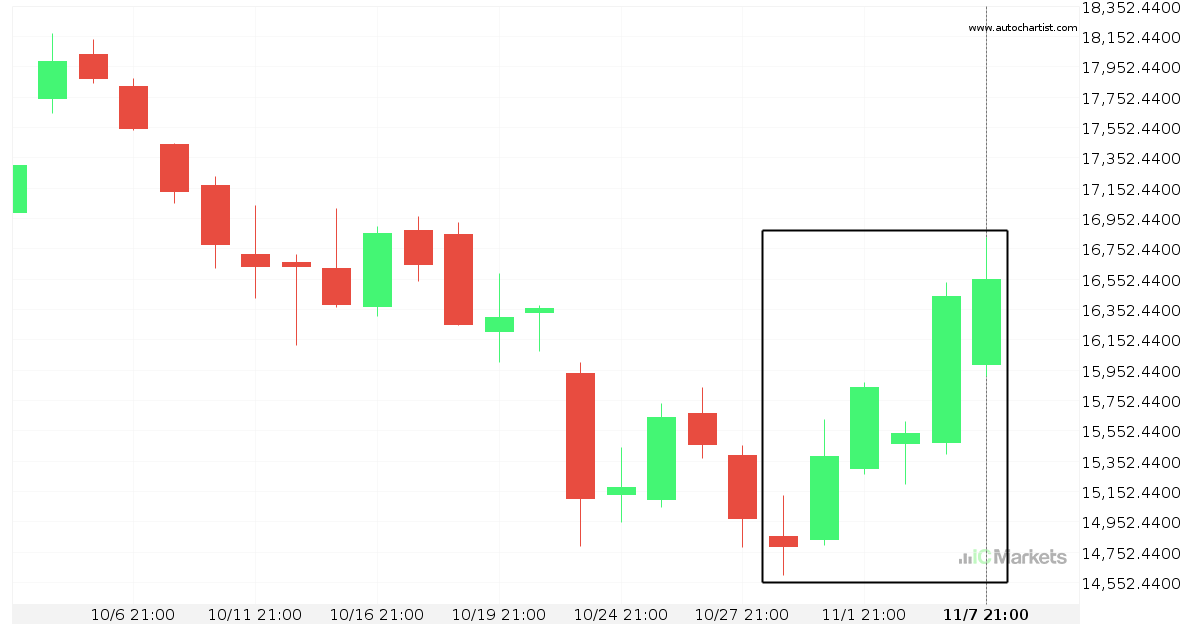
Huge bullish move on Hong Kong 50 Index
Hong Kong 50 Index has moved higher by 18.78% from 14784.8 to 17561.9 in the last 13 days.
FTSE China A50 Index – getting close to psychological price line
FTSE China A50 Index is moving towards a support line. Because we have seen it retrace from this level in the past, we could see either a break through this line, or a rebound back to current levels. It has touched this line numerous times in the last 6 days and may test it again […]
Hong Kong 50 Index is on its way up
Hong Kong 50 Index has experienced an exceptionally large movement higher by 9.39% from 16047.8 to 17555.4 in the last 2 days.
What’s going on with Australia 200 Index?
Those of you that are trend followers are probably eagerly watching Australia 200 Index to see if its latest 2.81% move continues. If not, the mean-reversion people out there will be delighted with this exceptionally large 23 hours move.
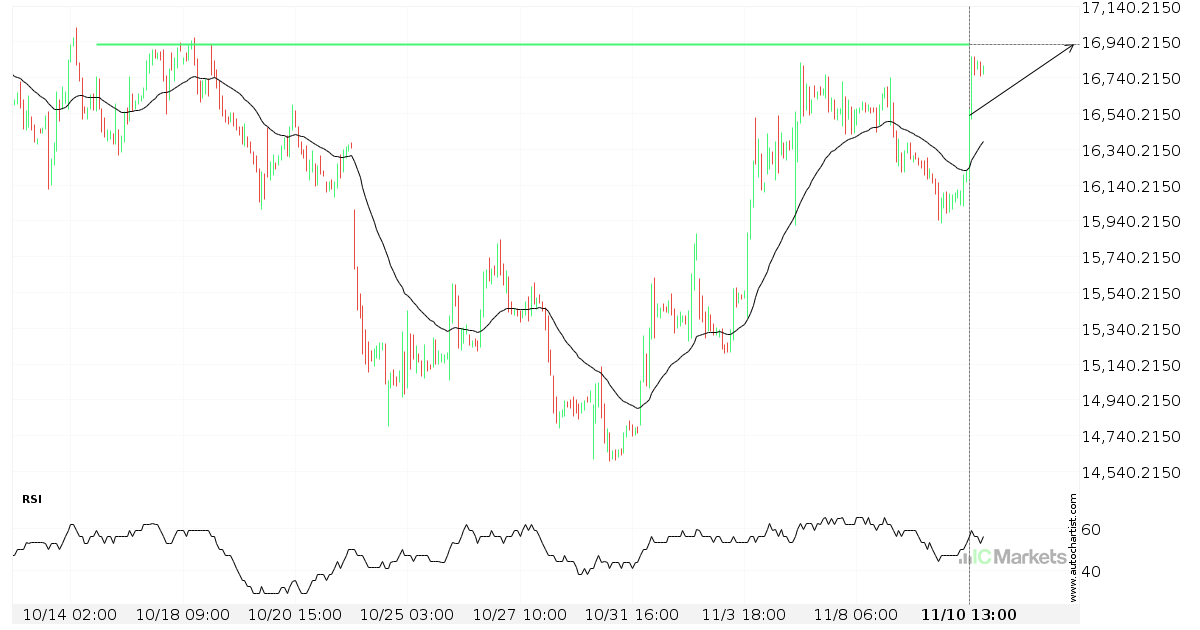
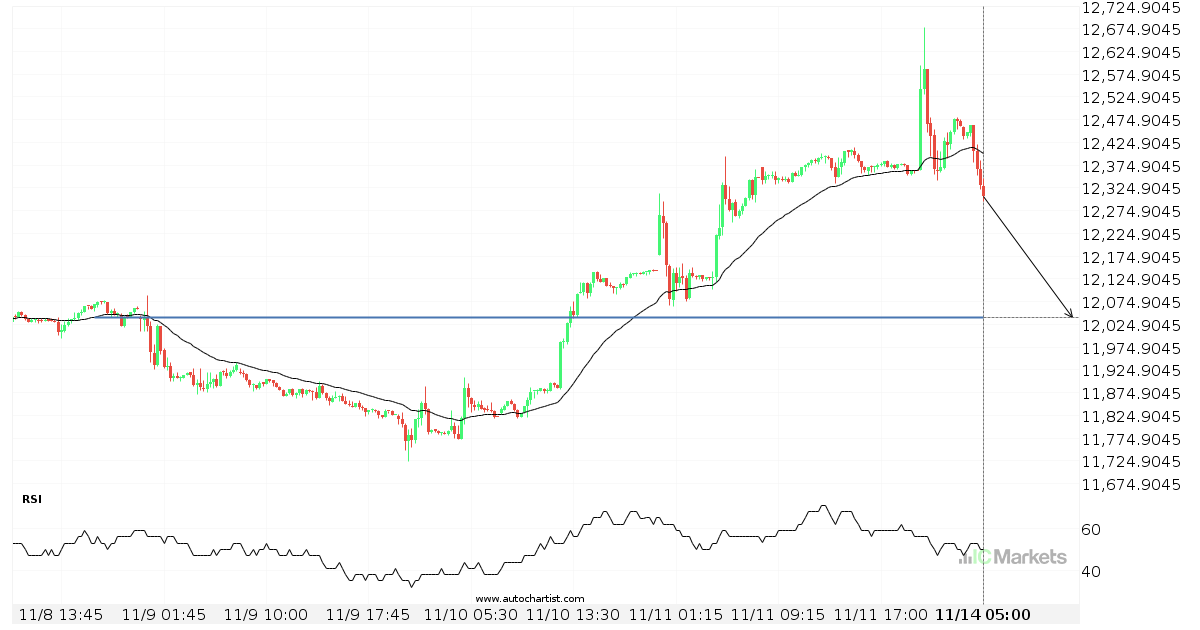
Breach of important price line imminent by Hong Kong 50 Index
Hong Kong 50 Index is moving towards a line of 16925.0996 which it has tested numerous times in the past. We have seen it retrace from this position in the past, so at this stage it isn’t clear whether it will breach this price or rebound as it did before. If Hong Kong 50 Index […]
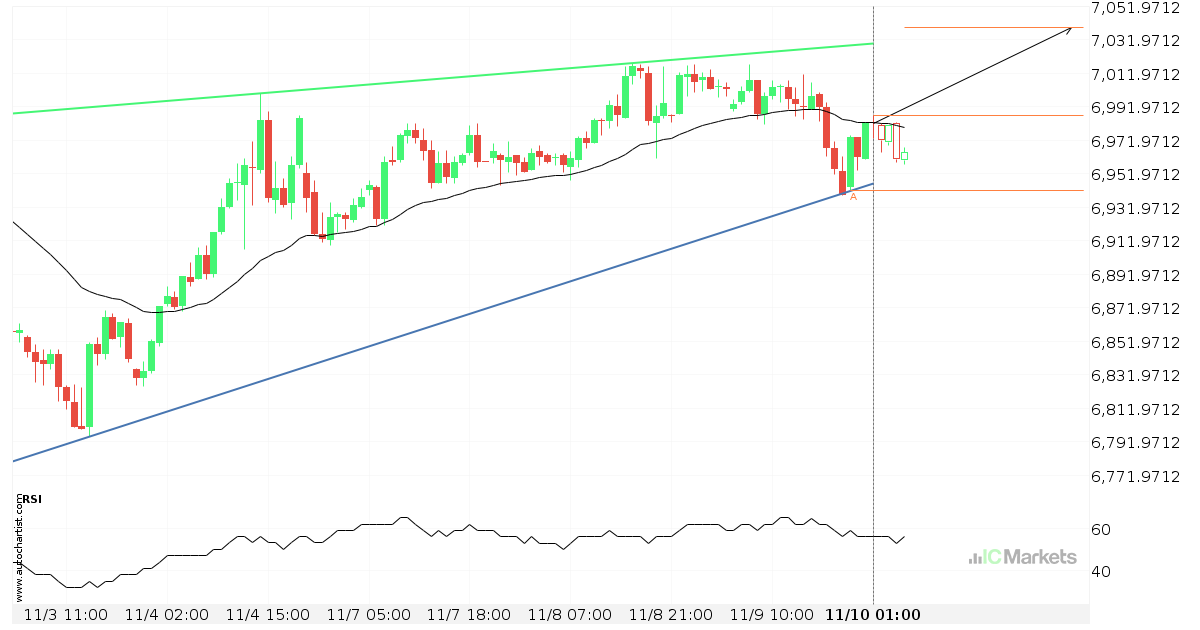
Possible breach of resistance level by Australia 200 Index
Australia 200 Index is moving towards a resistance line which it has tested numerous times in the past. We have seen it retrace from this line before, so at this stage it isn’t clear whether it will breach this line or rebound as it did before. If Australia 200 Index continues in its current trajectory, […]
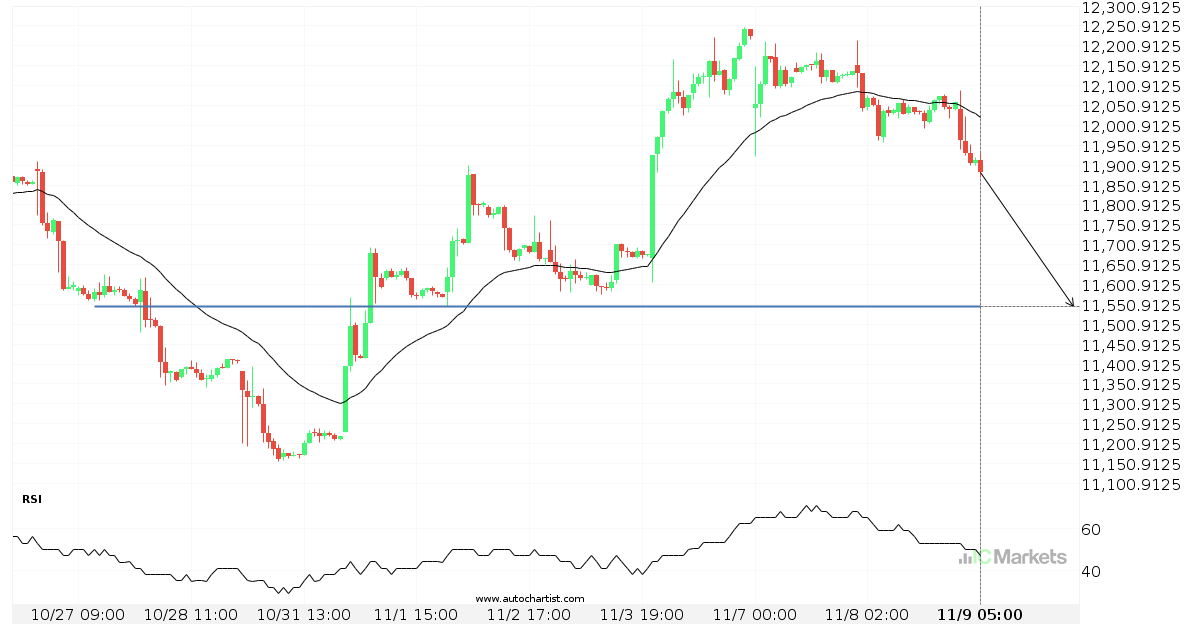
Either a rebound or a breakout imminent on FTSE China A50 Index
FTSE China A50 Index is heading towards a line of 11544.7305. If this movement continues, the price of FTSE China A50 Index could test 11544.7305 within the next 2 days. But don’t be so quick to trade, it has tested this line numerous times in the past, so this movement could be short-lived and end […]
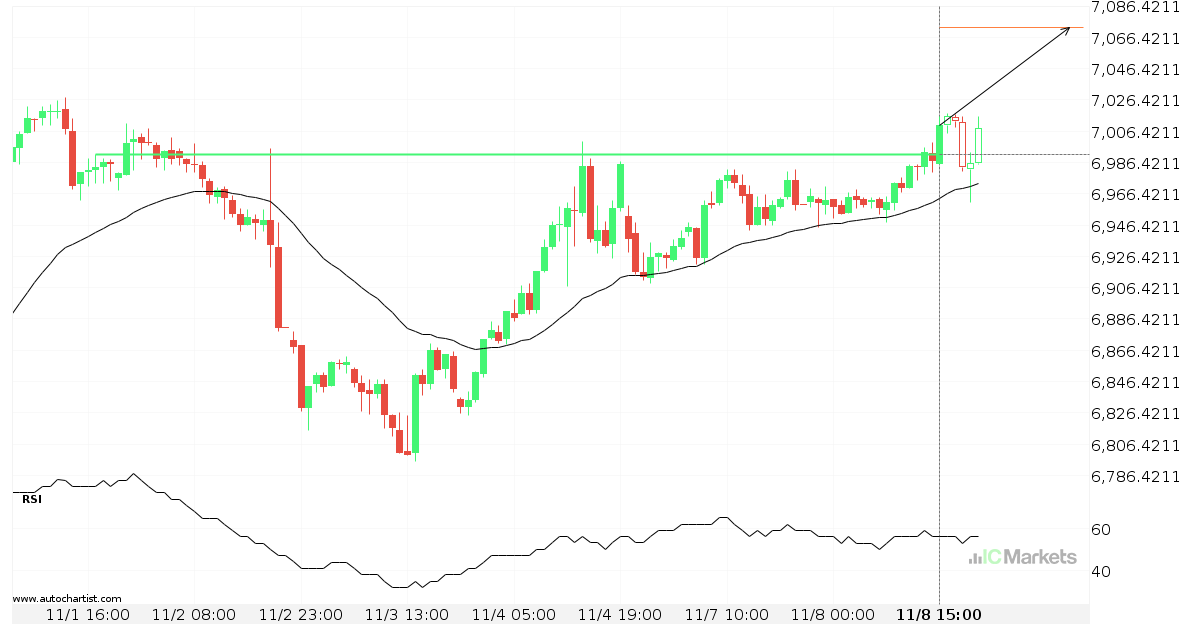
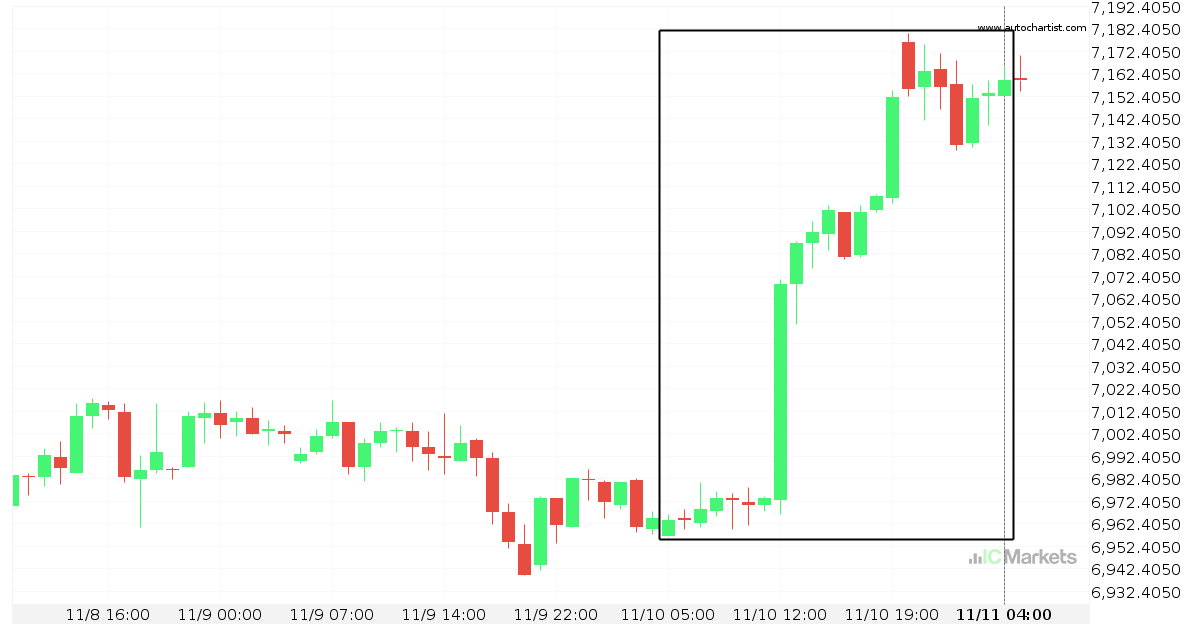
Australia 200 Index broke through important 6991.2002 price line
Australia 200 Index has broken through a resistance line. It has touched this line numerous times in the last 7 days. This breakout shows a potential move to 7072.5610 within the next 22 hours. Because we have seen it retrace from this level in the past, one should wait for confirmation of the breakout.
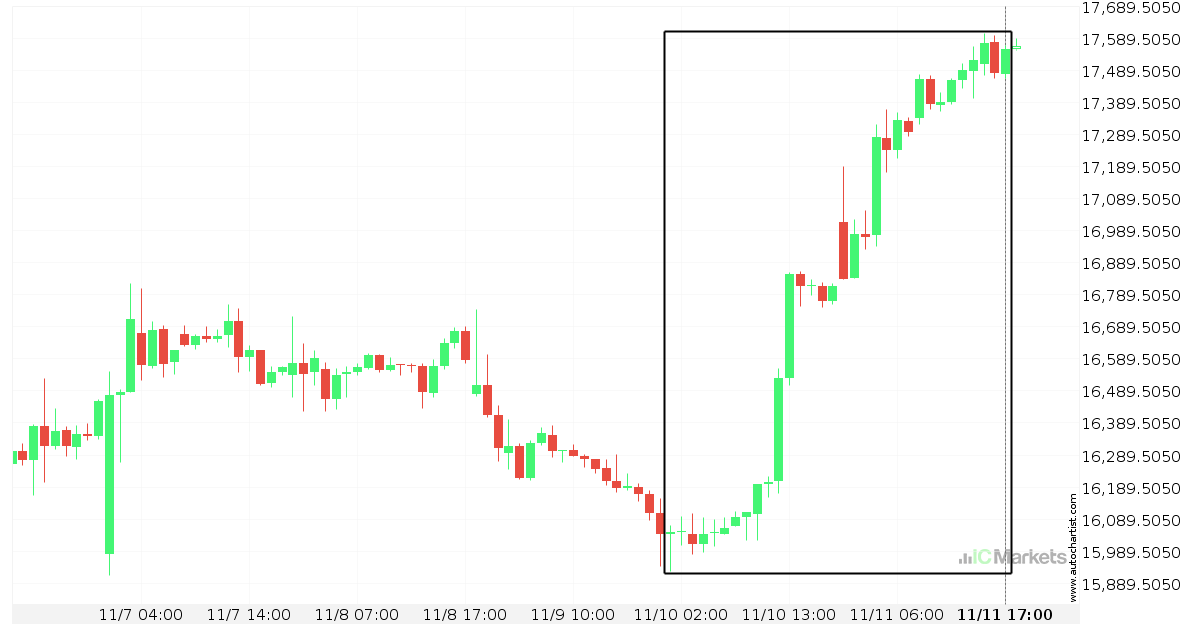
Huge bullish move on Hong Kong 50 Index
Hong Kong 50 Index has moved higher by 11.93% from 14784.8 to 16548.2 in the last 9 days.